Featured in an article from Rockwell Automation's The JournalXLReporter Helps Ocean Conservation
Aquariums play a crucial role in sustaining aquatic species vulnerable to habitat changes. They’re uniquely equipped to help develop conservation strategies.
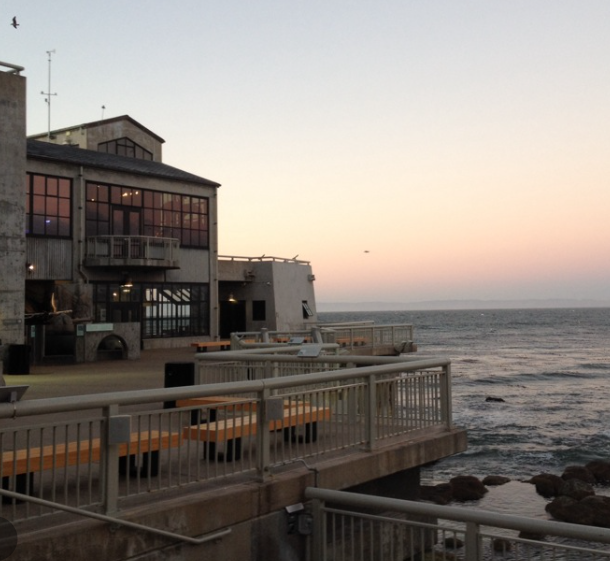
Monterey Bay Aquarium in Monterey, California is no exception. The mission of this nonprofit aquarium is to inspire conservation of the world’s ocean by showing the public the beauty and fragility of ocean life and the importance of preserving this ecosystem. One way it does this is through breathtaking exhibits showcasing thousands of ocean-dwelling animals and plants from both the Monterey Bay area and around the world.

Monterey Bay Aquarium Mission
The aquarium’s conservation mission is accomplished in part by designing and maintaining exhibits that replicate the natural habitat of ocean life form.
A vital part of this task is the continuous on-site ingestion of sea water from the bay. At an intake of more than 1,300 gallons per minute, the water is treated using life-support technology to regulate critical parameters, such as oxygen levels. Because exhibits replicate different biomes, ingested water is treated to
multiple different specifications. When the wastewater needs to be disposed, it’s treated and discharged back into the ocean.
The automated control system for this around-the-clock operation is complex, involving thousands of sensors, pumps, filtration systems, programmable logic controllers (PLCs) and other hardware.
The control system generates a vast volume of data that’s used by data-collection systems to create historical records of operation and performance. That data is used for analysis, improvement and cost reduction.
The aquarium water-science engineers found that while their control system and human-machine interface (HMI) are well-suited for monitoring and logging process data,
they didn’t offer an easy solution for processing data into metrics outside of the industrial software applications in which it is generated.
To address this challenge, Monterey Bay Aquarium leaders used XLReporter software from SyTech Inc. to manage its process data, improve operations,
and make the data easily available for outside entities such as a government agency or an academic researcher.
Aquarium Data Silos
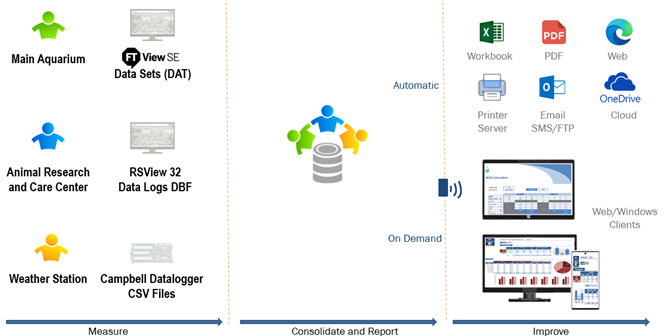
The systems at the aquarium evolved over time, creating a number of disparate data silos. Currently their process is divided into 3 isolated categories;1. The Main Aquarium and Outbuildings
- FactoryTalk® View SE Server
- Logging over 2,000 values from 60 PLCs every 10-30 seconds to DAT files
- Manual Data Entry forms
2. The Animal Research and Care Center (ARCC)
- RSView® 32
- Logging 262 values every 1 minute to DBF files
3. The Weather Station
- Uses a Campbell Scientific data logger for meteorological data
- Collects a dozen data points related to the ambient weather such as temperature, humidity, and pressure
- Text files containing last 1-3 days
Each location performs data collection independently, in their own format, which created data silos that could not be correlated easily.
XLReporter Innovations
The setup at Monterey Bay presents a few challenges; the data is not easy to access, timestamps between data sources are not synced, and there is no central namespace for all tags. Collectively the challenges made it difficult to select and compare information across the organization.
Using the following features of XLReporter, a number of improvements were made:
- Provides direct access to DAT files
- Consistent access to DBF files
- Data saved to SQL Server
- Single timestamp format implemented
- Raw data normalized to 1-minute samples
- Single namespace across all tables
- Automated Reports/Dashboards by email and Sharepoint
- On-Demand Reports/Dashboards from web clients

Data Consolidation
To improve their existing data collection systems, all data sources were exported into a central Microsoft SQL Server Database. As a result, over 25 tables were created, each with a consistent timestamp. The consolidation was handled by a combination of XLReporter and Rockwell Automation functionality, including some legacy components used to access the RSView data and a new REST API connector for FactoryTalk View SE called the FactoryTalk Data Agent.
The weather data was handled by XLReporter functionality that periodically monitored the rolling file and synchronized any new data into the database.
Since each log model created its own tag name list in the database, XLReporter’s Multi-table Database connector was used to make every tag from every table selectable for any report i.e., from the user’s perspective there was only a single tag space. This connector also provided “out-of-box” metrics and filters across every table.

Information Any Time, Any Where
The end result was a complete solution providing easily accesible information for staff members of the aquarium.For example, in order to be in compliance with California's Water Quality Control Plan, the aquarium needs to estimate the amount of sea water they are discharging. With XLReporter, these compliance metrics are calculated automatically in the background on a daily schedule, with no human intervention necessary.
XLReporter also helps the Animal Care Division during routine checks on animals in the exhibits and at the ARCC. Now, they use their cell phone or tablet to establish secure, role-based access to reports and dashboards.
Fulfilling ad-hoc data requests has also become a trivial matter for aquarium staff. XLReporter’s reporting engine allows any data point, from any source to be interpolated at any resolution, with the results saved to Excel, CSV, or to a relational database table. This means that if someone requests HVAC data as daily averages or interpolations over the course of 5 or 10 years, the results can be produced with a few clicks from any device on the aquarium network.

New Way of Thinking
A frictionless system for storing and accessing the aquarium’s process data has fundamentally changed the way the aquarium staff now think about how this knowledge can be used within their organization.